
You can improve only what you can measure. SafeMailer will help you track all important details of your campaigns and event to create deeply insightful, customized report.
SafeMailer has a dedicated analytics tab which provides detailed insights on how many emails were sent, opened replied or bounced on any particular day
To check the analytics, click on the “Analytics” tab on the left side of your campaign dashboard.
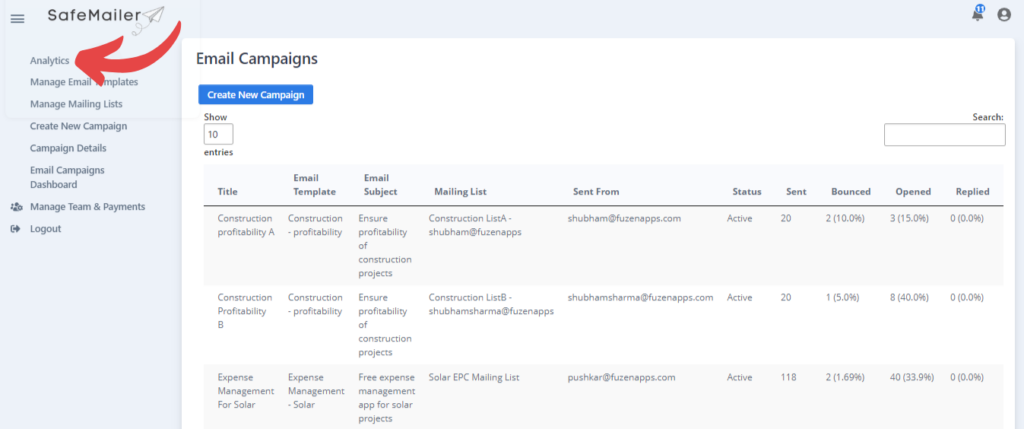
On the analytics page you can see all the details of emails that were sent in last 7 days.
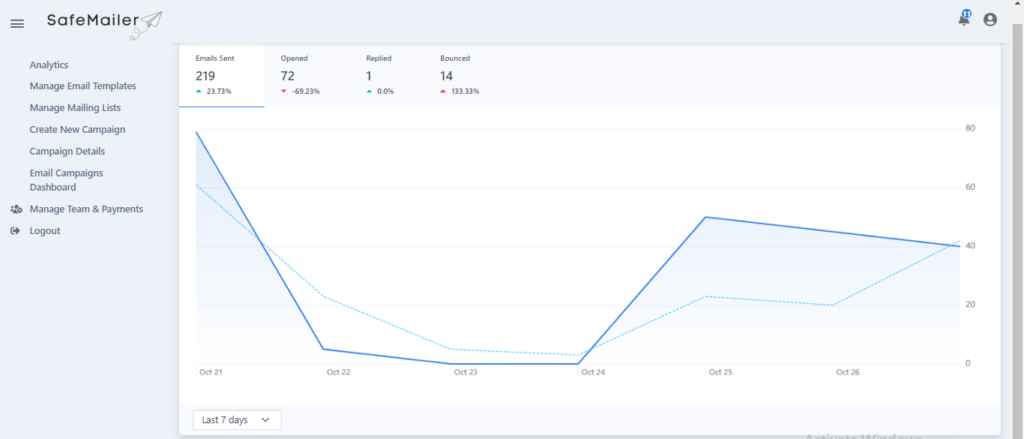
You can see total emails sent in last 7 days. Total emails that were opened, replied and bounced are also mentioned.
The dotted line in the charts provides difference between no. of emails sent in this week vs no. of emails sent a week before.
You can click on opened, replied and bounced to see the graph of that particular field.
You can use the filter at the bottom of the chart to see the graph of last month.
Individual campaign analytics #
SafeMailer also provides analytics for each individual campaign. For that click on campaign on the campaign dashboard.
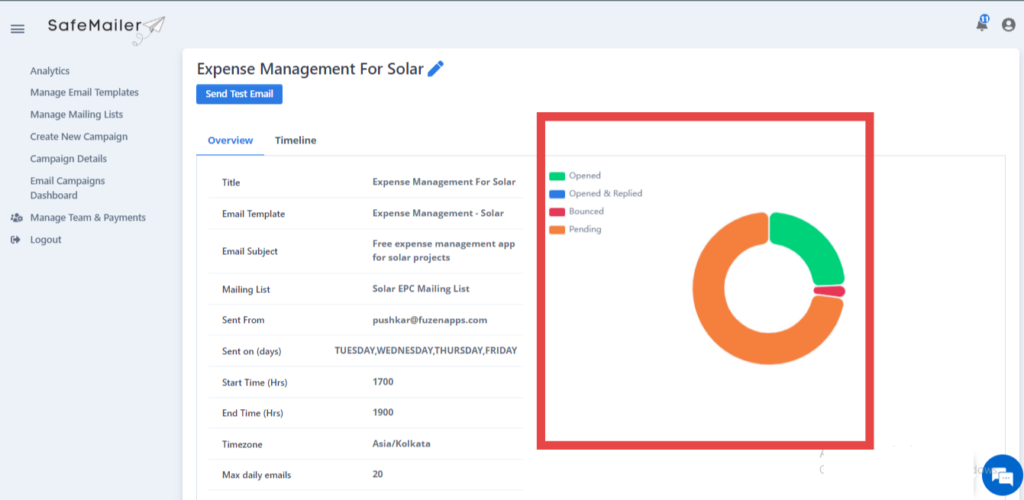
Here you can see how many emails were opened, opened and replied to, bounced, and are still pending through a doughnut pie chart. When you hover over the chart you can see the number of that particular lead.


